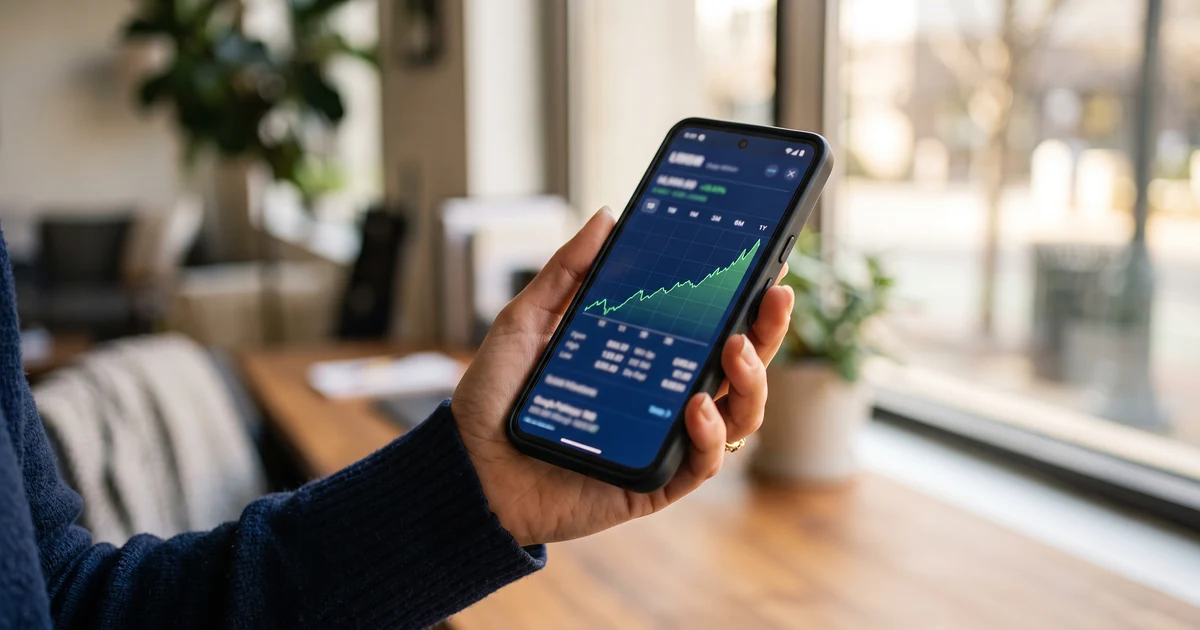
- The S&P 500 closed at a record high at least 27 times in 2026 through late August, up roughly 13% year-to-date at that point, and it rallied further on September 30 after inflation data beat expectations.
- August's PCE inflation report (released Sept 30, 2026) showed headline inflation at 3.4% and core inflation at 3.0% year-over-year — both cooler than economists expected and down from July's 3.3% core reading.
- Odds of an October 28 Fed rate hike fell to about 35% after the report, down from roughly 50% the day before and about 70% earlier in the week.
- Historically (1988-2023), the 12 months following a record close have averaged 13.4% gains for the S&P 500, versus 11.9% for any random 12-month period — though this is a historical pattern, not a guarantee.
- On a $50,000 balance, the difference between an 11.9% and 13.4% average annual return compounds to roughly $22,000 more after 10 years — a useful illustration of why steady, long-term investing matters more than reacting to any single headline.
A Record-Setting Year for Stocks
The S&P 500 has been on an unusually strong run in 2026. Through late August, the index had already closed at an all-time high 27 separate times that year and was up roughly 13% year-to-date — a pace that pushed the Dow Jones Industrial Average past the 54,000 mark for the first time in early August. That rally continued into late September, and it got another boost on September 30 when a key inflation report came in cooler than Wall Street expected, easing worries about another Federal Reserve rate hike.
What the Inflation Report Actually Showed
The Commerce Department's Personal Consumption Expenditures (PCE) price index for August 2026 — the Fed's preferred inflation gauge — was released September 30, 2026. Headline inflation came in at 3.4% year-over-year, below the 3.7% economists expected. Core PCE, which strips out volatile food and energy prices and is what the Fed watches most closely, came in at 3.0% year-over-year, down from 3.3% in July and below the 3.3% forecast. Core inflation also rose just 0.2% month-over-month, cooler than the 0.3% expected.
| Metric (August 2026, released Sept 30) | Actual | Expected | July 2026 |
|---|---|---|---|
| Headline PCE (YoY) | 3.4% | 3.7% | — |
| Core PCE (YoY) | 3.0% | 3.3% | 3.3% |
| Core PCE (month-over-month) | 0.2% | 0.3% | 0.3% |
What It Means for the October Fed Meeting
Cooler inflation data reduces the pressure on the Fed to keep raising rates. After the report, futures markets priced in only about a 35% chance of a rate hike at the Fed's October 28, 2026 meeting — down sharply from roughly 50% the day before the report and around 70% earlier in the week. New York Fed President John Williams said there was "no need for urgency" on further rate increases, and some economists, including Stephen Brown of Capital Economics, now expect the Fed to pause in October and reassess in December rather than hike again right away.
Stocks tend to react positively when inflation cools, because it reduces the odds that the Fed will keep raising interest rates. Higher rates make borrowing more expensive for companies and can make bonds more attractive relative to stocks — so any sign that rate hikes may be ending, or pausing, tends to support stock prices.
What History Says Happens After a Record-Setting Year
It's natural to wonder whether a year with this many record highs means stocks are "due" for a pullback. Historically, that hasn't been the pattern. Looking at data from January 1988 through December 2023, the S&P 500 gained an average of 11.9% over any random 12-month period — but when you isolate the 12-month periods that immediately followed a record closing high, the average gain was actually higher, at 13.4%. In other words, record highs have historically tended to be followed by more gains on average, not an automatic reversal — though this is a historical average, not a promise about what happens next, and downturns can still occur at any time regardless of past patterns.
| Scenario | Avg. 12-Month Return (1988-2023) | $50,000 After 10 Years* |
|---|---|---|
| Any random 12-month period | 11.9% | ~$153,911 |
| 12 months following a record close | 13.4% | ~$175,833 |
*Illustrative compounding at a constant rate for 10 years — real markets don't compound in a straight line, and this is meant to show the long-run effect of a rate difference, not a return prediction. Even a gap of about 1.5 percentage points a year adds up to roughly $22,000 more on a $50,000 balance after a decade, which is a useful reminder of how much small differences in average returns can matter for long-term goals like retirement.
📈 Project Your Own Portfolio's Growth
See what your actual balance and contributions could grow to under different return assumptions — for retirement, a taxable account, or any long-term goal.
Use the Investment Calculator →What This Means for Your Own Money
- Don't try to time a "record high" headline. As the historical data above shows, pulling out of the market because it hit a new record has often meant missing further gains — record highs are common in a rising market, not necessarily a warning sign.
- Keep contributing consistently to retirement accounts (401(k), IRA) regardless of where the market sits on any given day — dollar-cost averaging smooths out the ups and downs over time.
- Check your asset allocation. A strong rally in stocks can leave your portfolio more stock-heavy than your original target, so it may be a good time to review and rebalance rather than react to any single week's news.
- Remember this cuts both ways. A cooling-inflation, lower-rate environment can also mean lower yields on savings accounts and CDs going forward — worth checking if you're relying on cash savings for near-term goals.
- Run your own numbers rather than relying on generic averages — your actual timeline, contribution amount, and risk tolerance all matter more than any single headline statistic.
The historical pattern showing stronger returns after record highs is based on data from 1988-2023 and describes an average across many different periods — some of which still included significant pullbacks along the way. It should inform your thinking, not replace a plan built around your own timeline and risk tolerance.
Frequently Asked Questions
1. How many record highs has the S&P 500 hit in 2026?
The S&P 500 had closed at an all-time high at least 27 times in 2026 through late August, up roughly 13% year-to-date at that point, and continued rallying into late September 2026 as inflation data came in cooler than expected.
2. What did the August 2026 PCE inflation report show?
The Commerce Department's August 2026 PCE report, released September 30, 2026, showed headline PCE inflation at 3.4% year-over-year (versus 3.7% expected) and core PCE (excluding food and energy) at 3.0% year-over-year, down from 3.3% in July and below the 3.3% economists expected.
3. Does cooler inflation mean the Fed won't raise rates again in October?
It makes another October hike less likely, though not impossible. Futures markets priced in only about a 35% chance of an October rate hike after the report, down from roughly 50% the day before and about 70% earlier in the week. New York Fed President John Williams said there was "no need for urgency" on further hikes, and some economists now expect the Fed to pause in October and reconsider in December.
4. What typically happens to stocks after a year with many record highs?
Historically, record highs have tended to be followed by more gains, not a reversal. Between January 1988 and December 2023, the S&P 500 gained an average of 11.9% over any random 12-month period, but gained an average of 13.4% over the 12 months immediately following a record close — though past patterns are not a guarantee of future results, and pullbacks can still happen at any time.
5. Should I change my 401(k) or investment contributions because of record highs?
Most financial advisors caution against trying to time the market based on headlines about records, since stocks can keep setting new highs for extended periods, and pulling back can mean missing further gains. A more common approach is to keep contributing consistently (dollar-cost averaging) and periodically rebalance to your target asset allocation rather than reacting to any single data point.